“Play to Win is an independent digital platform that provides statistical insights, strategic frameworks, and educational resources related to EuroMillions gameplay. We do not facilitate ticket purchases, accept wagers, distribute winnings, or operate as a gambling provider.
All content is intended for informational and entertainment purposes only. Use of this platform does not guarantee results, and users should always play responsibly.
Play to Win supports informed, mindful participation in games of chance. If you feel that gambling is negatively impacting your life, please seek advice from
BeGambleAware or
GamCare.”

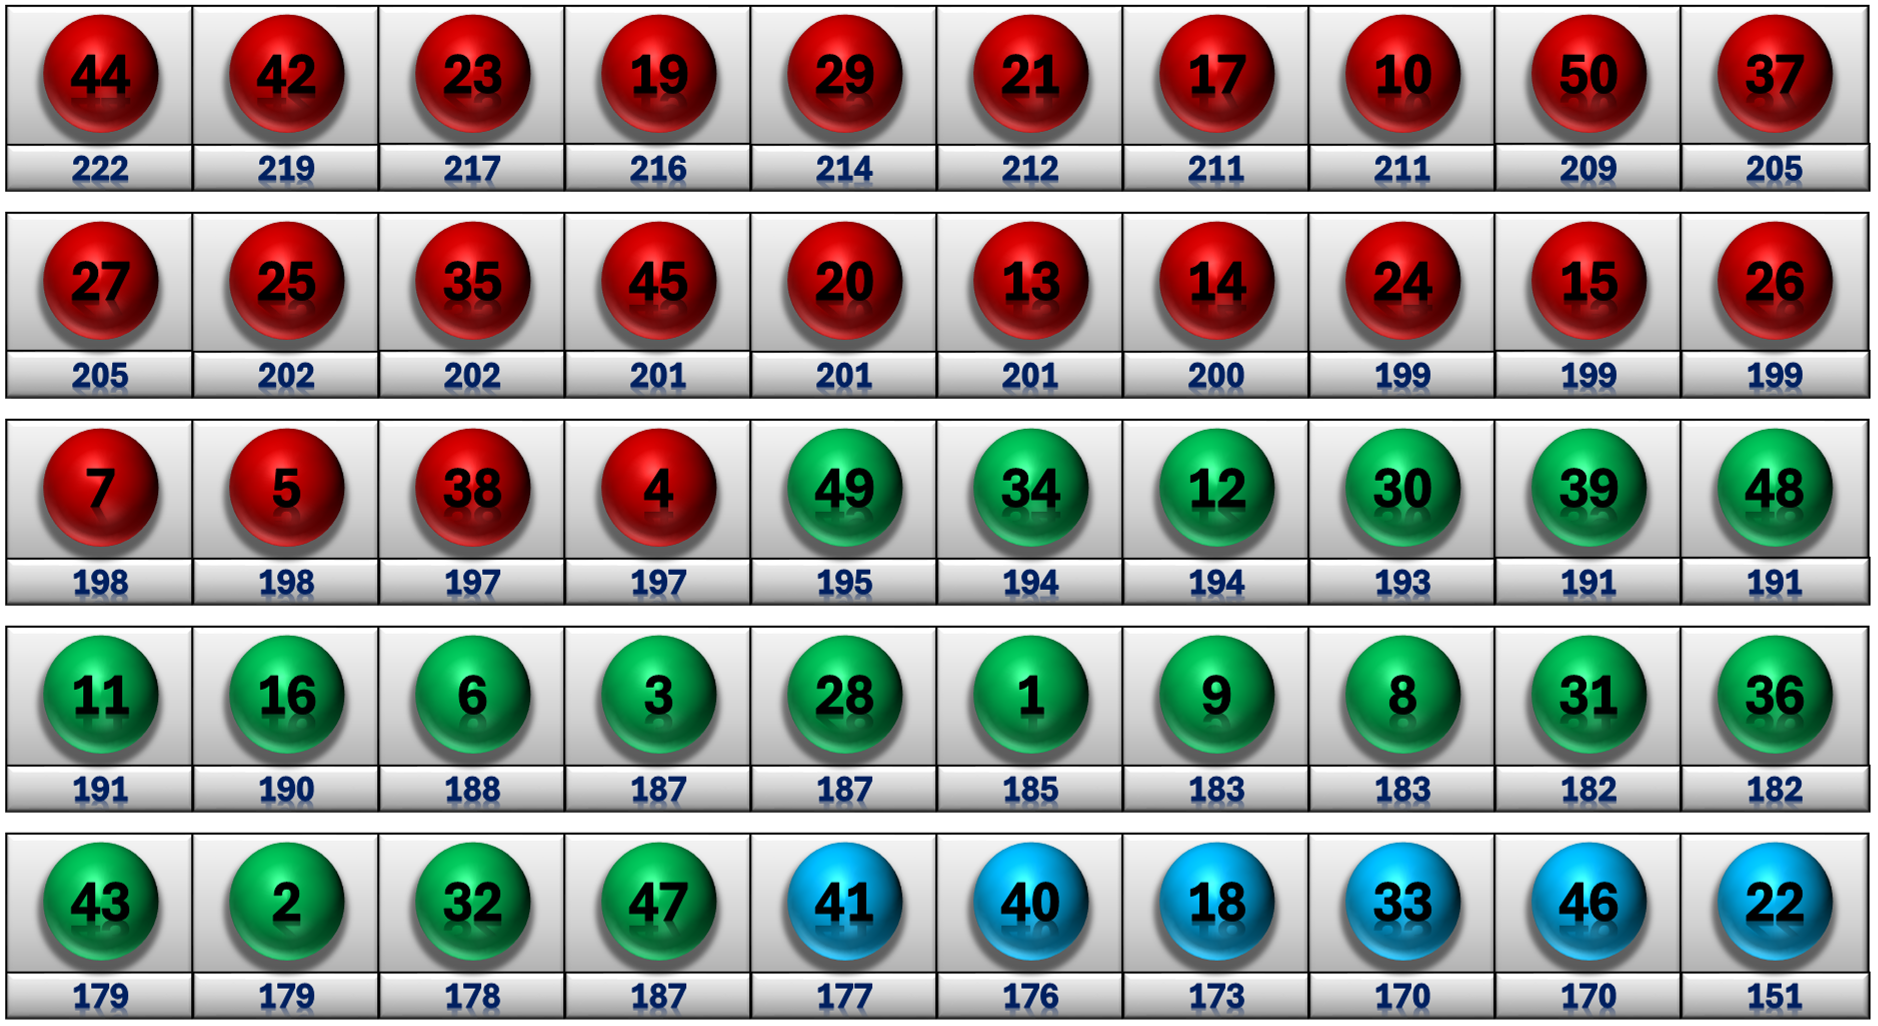
- Every number appears on average between 8 and 13 times a year and each number has the exact same chance of being drawn as any other number. The number of previous appearances does not guarantee future performance.
However, a handy little tip is to use the colours to help with your number selection
- Red Numbers are Leading Numbers simply because they have repeated more times than Green or Blue numbers.
- Green Numbers are Following Numbers which have repeated more than Blue numbers but not as often as Red.
- And Blue Numbers are Trailing Numbers which were among the last numbers to be drawn when Euromillions began back in 2004 so they're always playing catch up.
- This is a handy chart to keep you updated with the frequency and colour of each number.
- Odd/Even- For reference note the frequency of Odd & Even numbers to help with your number selection.

An important thing to remember about the 50 Main Ball Numbers and the 12 Lucky Stars- It isn't about frequency, every single number has the exact same chance of being drawn in any game, so lose the Hot/Cold fallacy, it's meaningless.
What it is about is REPETITION. Each number is drawn on average between 8 and 13 times each year.
There's no such thing as Hot or Cold Numbers. When choosing your numbers, don't just go for the red numbers, micx up the colours and have a look at our Colour Sets performance page.


This is simply a guide to keep track of the main ball numbers as they progress through their cycles each year.
Remember, previous years performance doesn't mean that number will perform the same in each year.
This chart is to help you make an informed choice relating to those numbers already drawn and those due to appear in the current year.

